
 (Amounts in thousands of pesos, except earnings per share, which is shown (Amounts in thousands of pesos, except earnings per share, which is shown in pesos, and outstanding shares) |
2019 | 2020 | 2021 | Var% 2021-2020 |
|---|---|---|---|---|
| Sales | 102,477,596 | 94,684,370 | 124,572,789 | 31.6% |
| Gross Profit | 29,139,883 | 23,728,955 | 30,624,023 | 29.1% |
| Operating Income | 11,453,226 | 8,916,259 | 12,856,985 | 44.2% |
| EBITDA | 14,481,063 | 11,206,330 | 15,723,702 | 40.3% |
| Controlling Participation in Net Income | 7,547,361 | 5,706,408 | 11,282,039 | 97.7% |
| Earnings per share (EPS)* | 3.31 | 2.51 | 5.00 | 99.5% |
 Margins Margins |
||||
| Gross | 28.4% | 25.1% | 24.6% | -0.5 pp |
| Operating | 11.2% | 9.4% | 10.3% | 0.9 pp |
| EBITDA | 14.1% | 11.8% | 12.6% | 0.8 pp |
| Net | 7.4% | 6.0% | 9.1% | 3.0 pp |
 Revenues Revenues |
||||
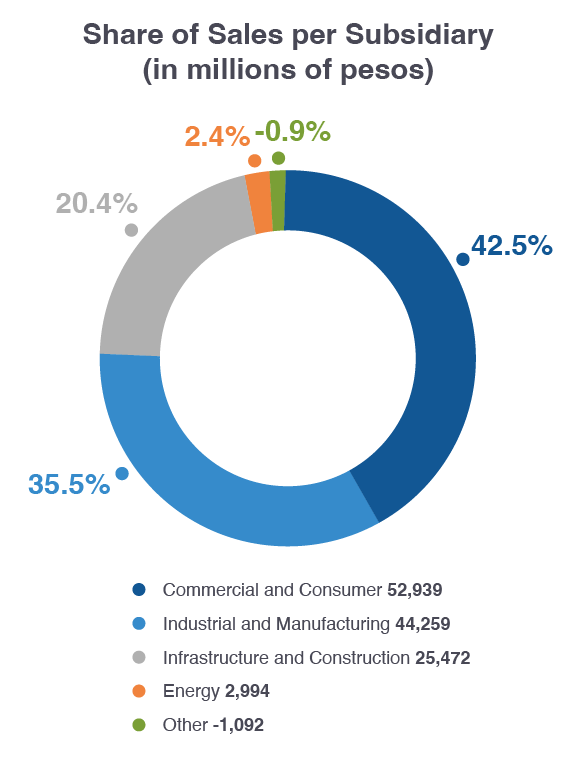
| Retail | 53,288,479 | 39,612,874 | 52,939,372 | 33.6% |
| Industrial | 31,746,579 | 32,936,523 | 44,259,032 | 34.4% |
| Infrastructure and Construction | 19,537,994 | 24,541,851 | 25,472,323 | 3.8% |
| Energy | 51,570 | 911,757 | 2,994,411 | 228.4% |
 EBITDA** EBITDA** |
||||
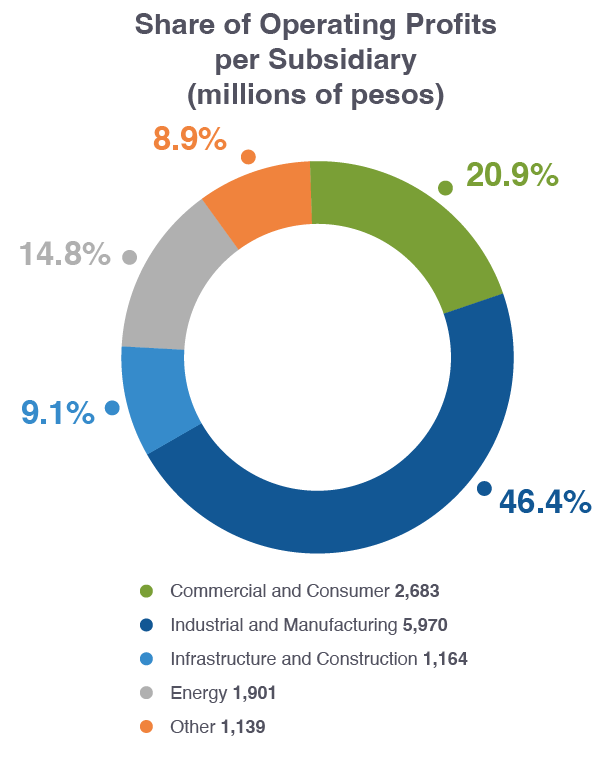
| Retail | 6,789,470 | 2,040,573 | 4,724,106 | 131.5% |
| Industrial | 4,240,699 | 4,653,908 | 6,026,669 | 29.5% |
| Infrastructure and Construction | 2,706,603 | 3,644,920 | 1,828,355 | -49.8% |
| Energy | -9,324 | 560,633 | 2,280,280 | 306.7% |
 EBITDA Margins EBITDA Margins |
||||
| Retail | 12.7% | 5.2% | 8.9% | 3.8 pp |
| Industrial | 13.4% | 14.1% | 13.6% | -0.5 pp |
| Infrastructure and Construction | 13.9% | 14.9% | 7.2% | -7.7 pp |
| Energy | -18.1% | 61.5% | 76.2% | 14.7 pp |
| Total Assets | 150,453,925 | 169,826,599 | 185,773,253 | 9.4% |
| Total Liabilities | 55,809,365 | 69,111,756 | 71,698,606 | 3.7% |
| Stockholders' Equity | 94,644,560 | 100,714,843 | 114,074,647 | 13.3% |
| Compounded Average Outstanding Shares ('000) | 2,280,862 | 2,276,143 | 2,255,249 | -0.9% |
*EPS: Calculated as Controlling Participation in Net Income divided by the compounded average shares outstanding.
**EBITDA: Income before income taxes plus depreciation and amortization, interest expense, impairment of machinery
and equipment and exploration expenses, and effect on valuation of derivative financial instruments, less interest
income, net foreign exchange gain, surplus from appraisals of shopping centers and equity in earnings of associated
companies and joint ventures. Conciliation in Note 32 of the FInancial Statements.
pp: Variation in percentage points.
*Note: The calculation of EBITDA for 2018 included the net effect of fixed asset impairment, exploration and goodwill and the revaluation of investment properties, for the calculation of EBITDA for the 2019 fiscal year, the net effect of the revaluation of investment properties, reversal of impairment of fixed assets and remediation of environmental were not included, and for the calculation of EBITDA for the fiscal year 2020, the net effect of the revaluation of investment properties, valuation of labor obligations, impairment of exploration expenditures, impairment of fixed assets and environmental remediation were not included.
